On Friday, there were several entry points. Now, let's look at the 5-minute chart and figure out what actually happened. In my morning article, I turned your attention to 1.0889 and recommended making decisions with this level in focus. A breakout of 1.0801 occurred without an upward retest. So, there were no entry points into long positions. For the afternoon, a false breakout of 1.0724 gave a buy signal, which led to a rise of more than 40 pips.
When to open long positions on EUR/USD:
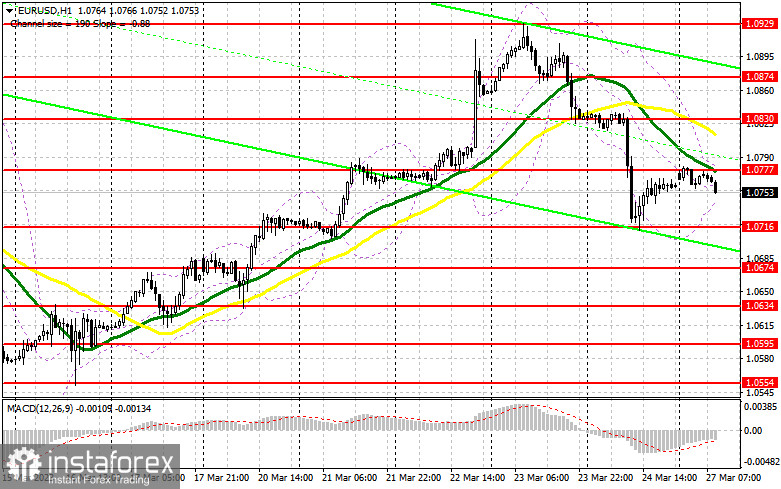
Today, Germany will unveil economic reports. Apart from that, several ECB policymakers will make speeches. It means that the euro has a chance to recover in the morning. The ifo Business Climate Index for Germany turns out to be worse than forecasts, the pair will face strong bearish pressure. It could reach the support level of 1.0716. Last Friday, the pair rebounded from this level as traders increased long positions at this level. A false breakout of this level could provide good entry points into long positions. It may lead to an upward movement to the resistance level of 1.0777. A breakout and a downward retest may create an additional entry point into long positions with a jump to 1.0830. At this level, the moving averages are benefiting bears. It will be difficult for the bulls to push the pair above this level. A breakout of 1.0830 will force the bears to close their Stop Loss orders. It will stimulate a bull market, giving an additional buy signal with the prospect of a rise to 1.0874. At this level, I recommend locking in profits. If EUR/USD declines and buyers show no activity at 1.0716, the pressure on the euro will increase significantly, boosting a bear market. A breakout of this level will trigger a fall in EUR/USD to the support level of 1.0674. Only a false breakout could provide new entry points. You could buy EUR/USD at a bounce from 1.0634 or 1.0595, keeping in mind an upward intraday correction of 30-35 pips.
When to open short positions on EUR/USD:
Sellers are in control now. They need to push the pair to 1.0777, especially if there is no reaction to the hawkish comments of ECB Executive Board Members Joachim Nagel. Frank Elderson, and Isabelle Schnabel. It will surely lead to a decline. It is better to open short positions after a false breakout of 1.0777. The pair is likely to slide to the support level of 1.0716. A breakout and an upward retest of this level will trigger a fall to 1.0674. Consolidation below this level amid weak macro stats on Germany may help bears push the pair to 1.0634, which will bolster the bearish sentiment. At this level, I recommend locking in profits. If EUR/USD pair climbs during the European session and bears show no energy at 1.0777, which is likely, I would advise you to postpone short positions until a false breakout of 1.0830. You could sell EUR/USD at a bounce from 1.0874, keeping in mind a downward intraday correction of 30-35 pips.
COT report
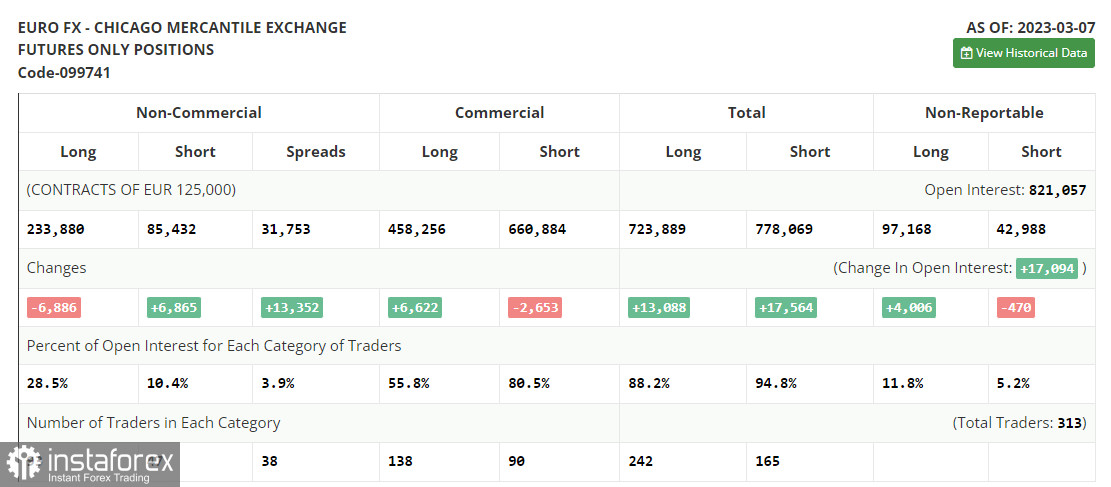
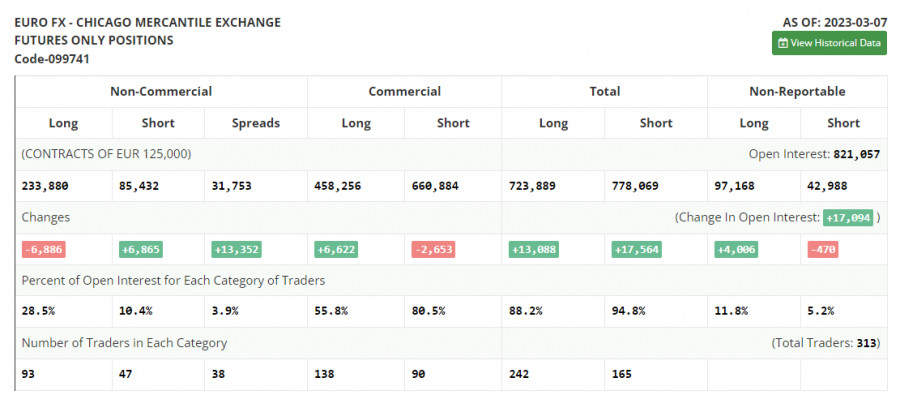
According to the COT report from March 7, the number of long positions dropped, whereas the number of short positions increased. Notably, the data is of zero importance at the moment as it was relevant two weeks ago. The CFTC is still recovering after a cyberattack. It is better to wait for new reports. This week, the Federal Reserve will hold a meeting, during which it may pause the monetary policy tightening. The fact is that the problems in the banking sector and the launch of a new credit swap line to support other banks with liquidity may seriously affect the economy. If Jerome Powell decides to raise the key rate higher, the US dollar is unlikely to receive support. Traders are pricing in the Fed's switch to a less hawkish stance and monetary policy loosening by the end of the year. The COT report unveiled that the number of long non-commercial positions dropped by 6,886 to 233,880, while the number of short non-commercial positions increased by 6,865 to 85,432. At the end of the week, the total non-commercial net position decreased to 148,448 against 165,038. The weekly closing price dropped to 1.0555 against 1.0698.
Indicators' signals:
Trading is carried out below the 30 and 50 daily moving averages, which indicates a trend reversal.
Moving averages
Note: The period and prices of moving averages are considered by the author on the H1 (1-hour) chart and differ from the general definition of the classic daily moving averages on the daily D1 chart.
Bollinger Bands
If EUR/USD declines, the indicator's lower border at 1.0750 will serve as support.
Description of indicators
- Moving average (moving average, determines the current trend by smoothing out volatility and noise). Period 50. It is marked yellow on the chart.
- Moving average (moving average, determines the current trend by smoothing out volatility and noise). Period 30. It is marked green on the chart.
- MACD indicator (Moving Average Convergence/Divergence - convergence/divergence of moving averages) Quick EMA period 12. Slow EMA period to 26. SMA period 9
- Bollinger Bands (Bollinger Bands). Period 20
- Non-commercial speculative traders, such as individual traders, hedge funds, and large institutions that use the futures market for speculative purposes and meet certain requirements.
- Long non-commercial positions represent the total long open position of non-commercial traders.
- Short non-commercial positions represent the total short open position of non-commercial traders.
- Total non-commercial net position is the difference between the short and long positions of non-commercial traders.